Debugging
Debugging the BlueStack SDK involves configuring and testing to ensure a smooth development experience. Enabling debug mode will provide detailed logs for the BlueStack SDK and all of it's adapters for easy troubleshooting.
Use the Xcode debug console to analyze runtime logs, verify event triggers, and monitor network calls. For specific issues, refer to error codes provided in the SDK documentation.
Enable Debug Mode
To enable debug, you must first register your device as a Test Device in the BlueStack Console. Select Inventory > Your App > Test Devices and press the New + button to add a device.
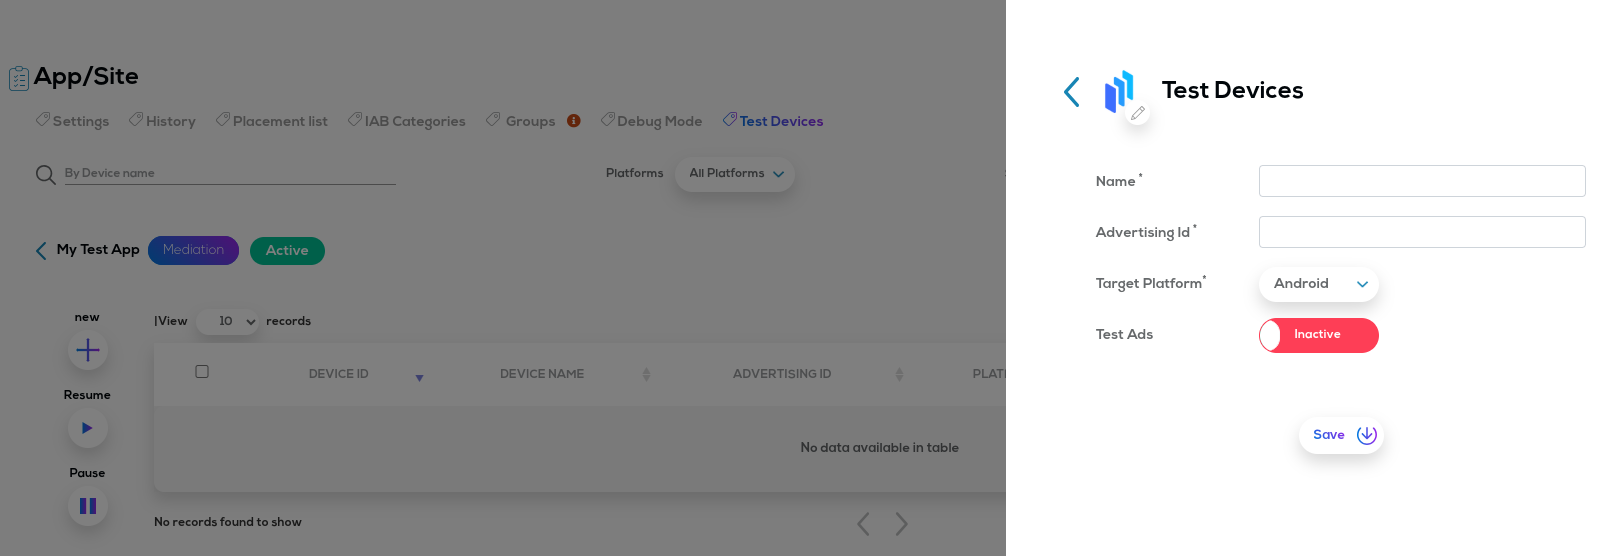
Enter any name for the device that your adding, and it's corresponding IDFA (iOS) or GAID (Android). The device is now registered as a test device and debug mode is automatically enabled .
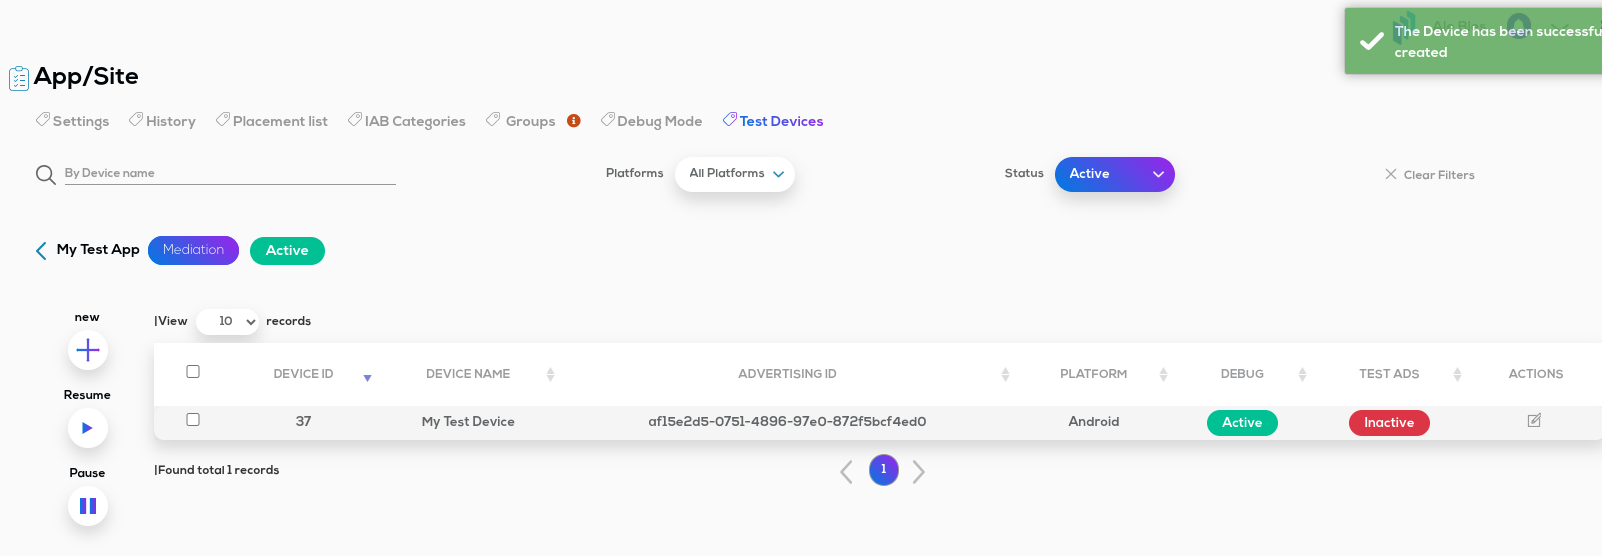
It might take a few minutes before the changes are fully propagated to the SDK, alternatively you can also enable the debug mode programmatically:
- Objective C
- Swift
[[BLSMobileAds sharedInstance] setDebugModeEnabled:DEBUG_ENABLED];
MobileAds.sharedInstance().setDebugMode(enabled: debugEnabled)
Open Debug Screen
Once Debugging has been enabled, you can simply bring up the debug menu by checking your device from left to right. It will present you with a set of buttons, one of which will allow you to clear any local caching from the SDK (config, ads, etc)
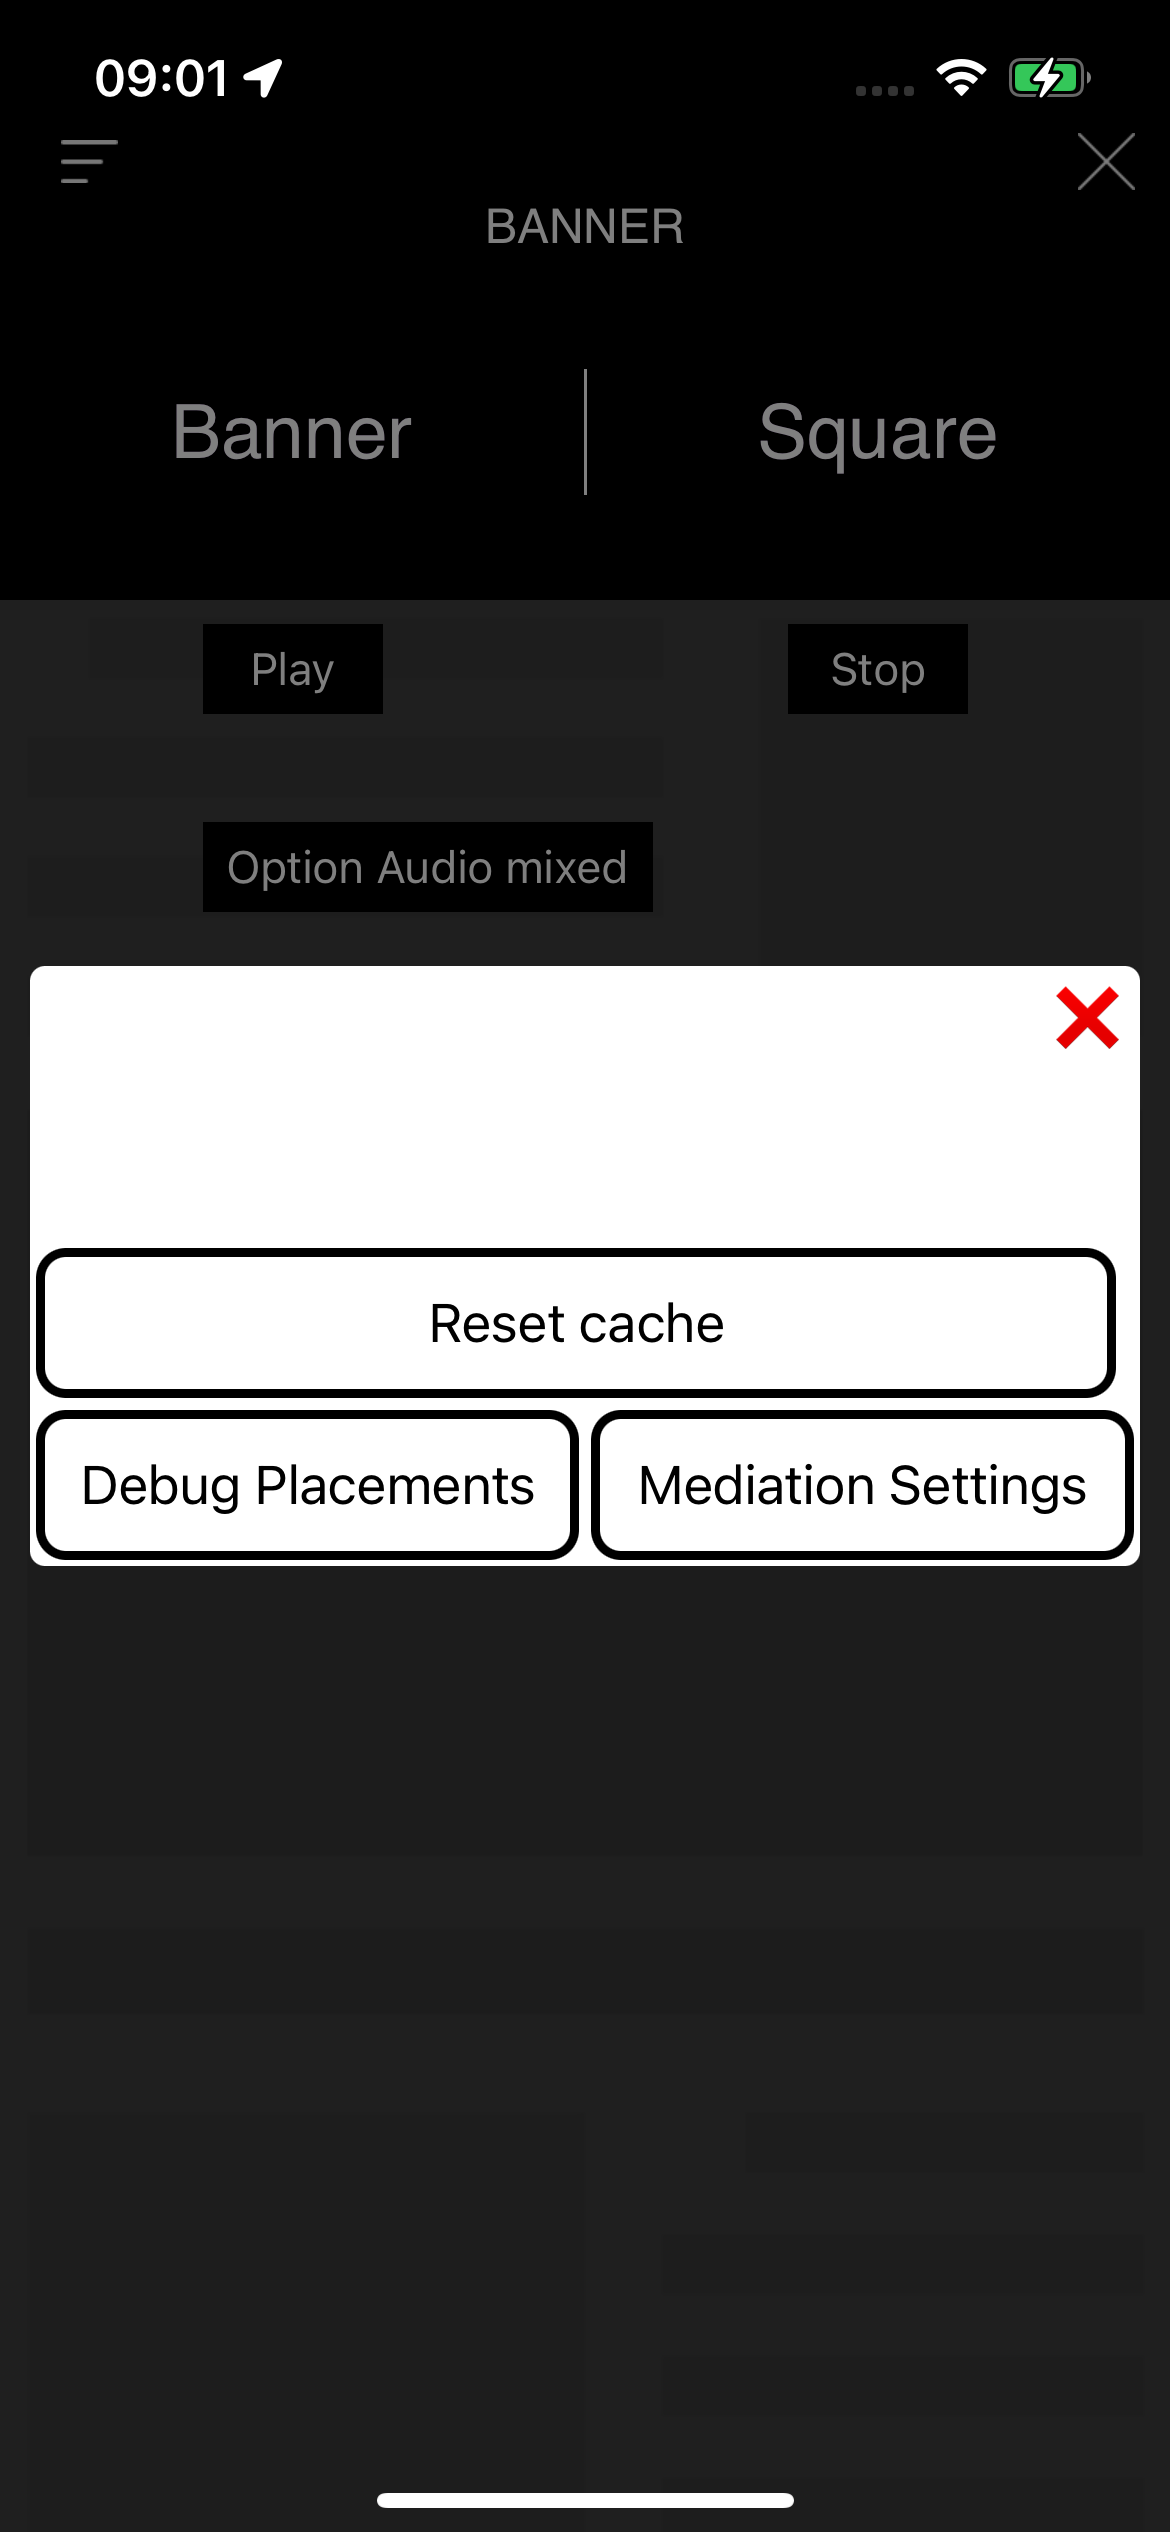
| Network Infomation | Debug placements |
|---|---|
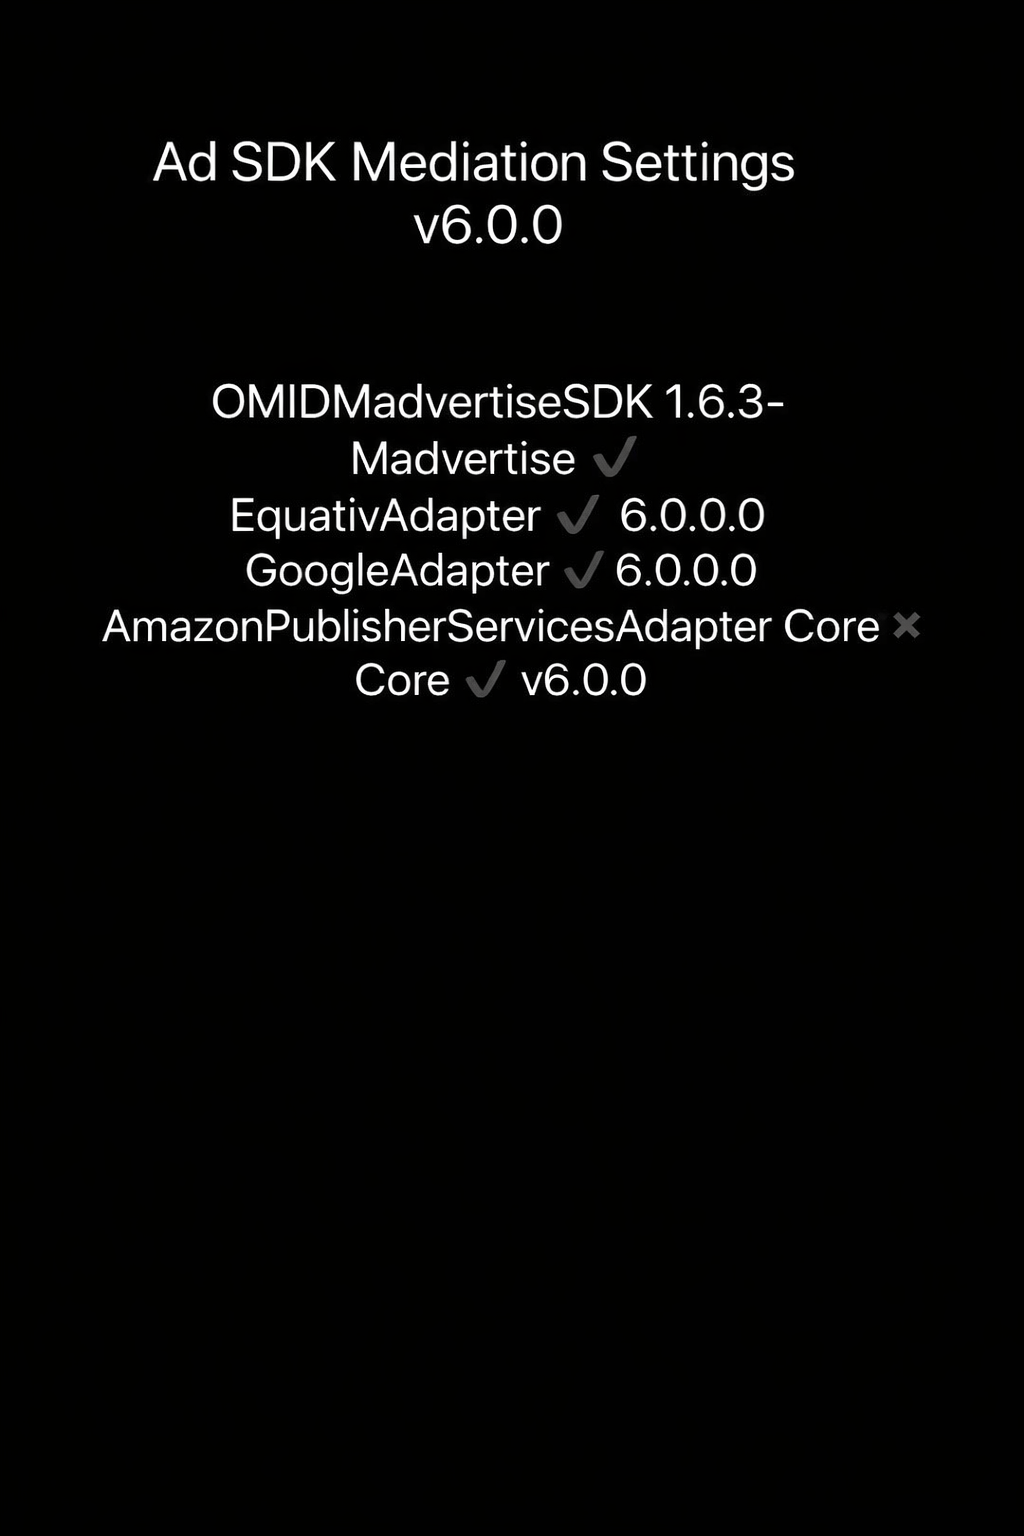
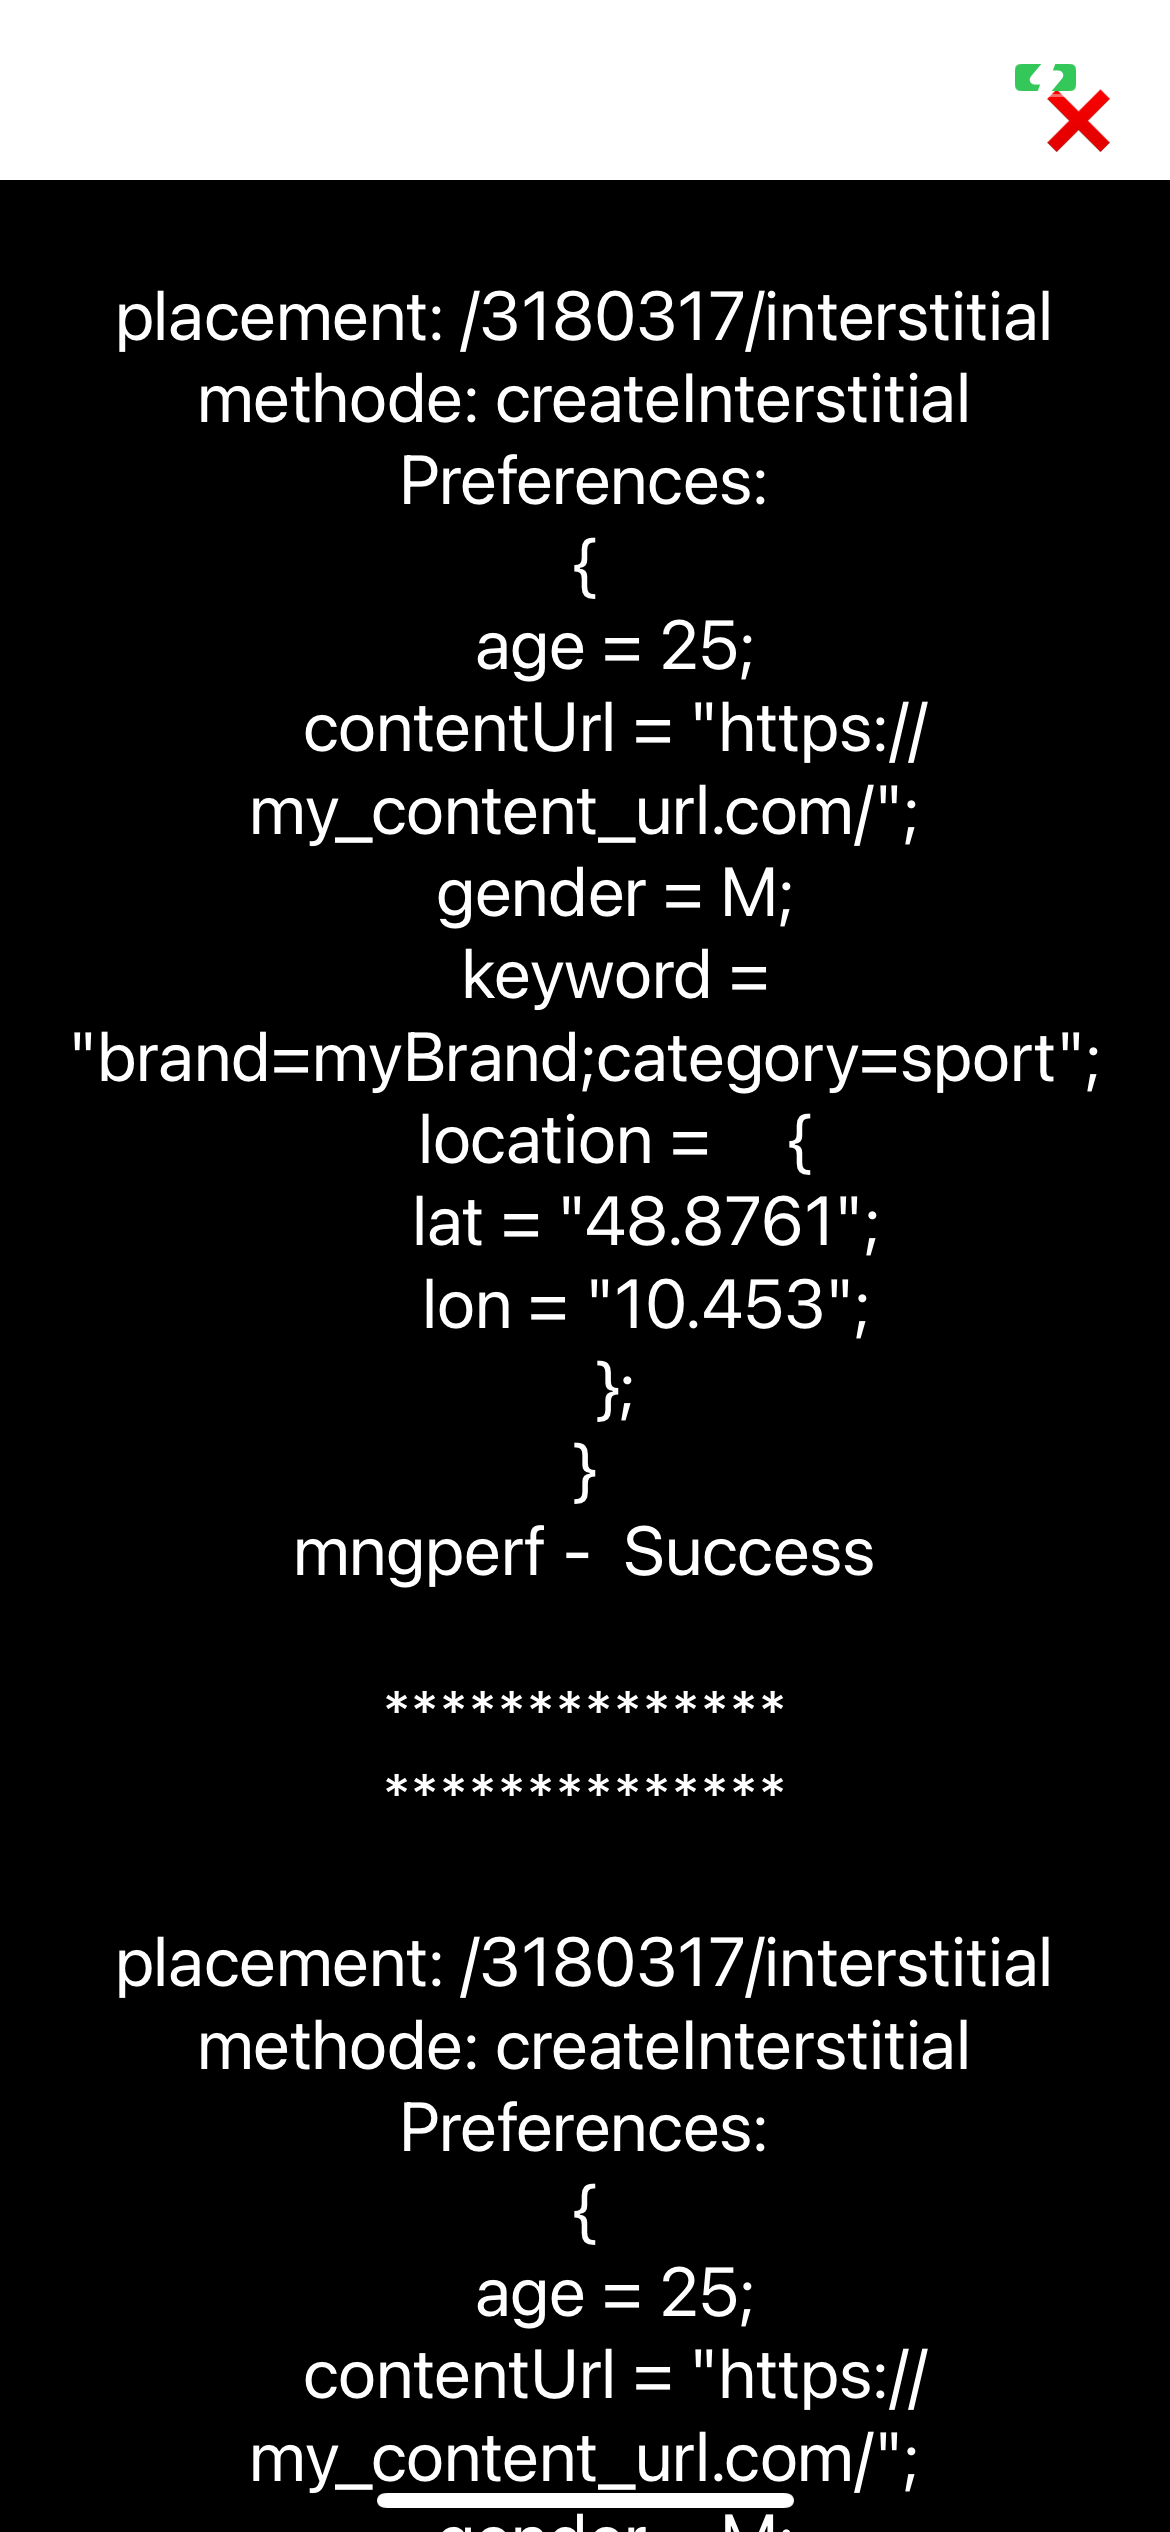
| On the Mediation settings page you'll be able to see which adapaters have been properly actived. If they indicated a cross they either have been misconfigured, not installed, or perhaps another issue that might have traces of debug information in the debug logs. | The Debug SDK also allows you to inspect the last 3 ad requests made. You'll be able to see the response status for all the networks that have been activated on the placement. The passed Request Options will also be visible for inspection. |
 |  |
Test Placements
A quick way to enable testing is to use the predefined test placements below. They will always deliver ads for a specific format and they will not be reported towards your account.
| Ad format | Test Placement ID |
|---|---|
| App Open | /3167505/appopen |
| Banner | /3167505/banner |
| MREC | /3167505/mrec |
| Interstitial | /3167505/interstitial |
| Rewarded Video | /3167505/rewarded |
| Native | /3167505/native |
Please make sure you replace the Placement ID's above with the ones provided by your Azerion representative before going live